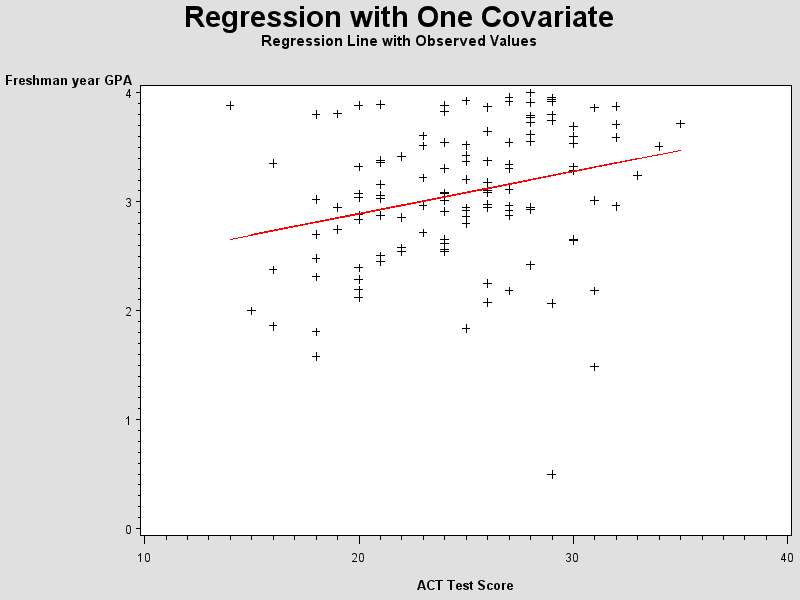
| Regression with One Covariate |
| Variable | Label | N | Mean | Std Dev | Minimum | Maximum | ||||||||||||||
|---|---|---|---|---|---|---|---|---|---|---|---|---|---|---|---|---|---|---|---|---|
|
|
|
|
|
|
|
| Regression with One Covariate |
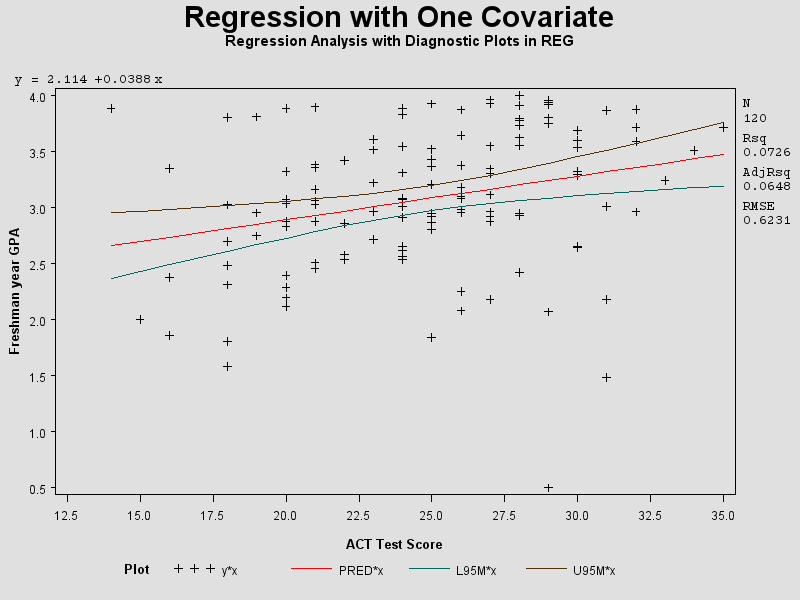
| A Scatterplot of GPA on ACT test score |
                                Plot of y*x.  Symbol used is '*'.

   4.0 ˆ                                                      *   *
       ‚  *                       *   *           *   *       *   *   *           *
       ‚                  *   *                   *       *       *   *       *
       ‚                                                          *   *           *           *
       ‚                                                  *               *
       ‚                                      *   *           *   *       *       *
   3.5 ˆ                                      *       *                   *               *
       ‚                              *   *           *   *
       ‚          *               *   *           *   *       *           *
       ‚                                      *                           *           *
       ‚                              *               *   *
       ‚                          *   *           *       *   *
   3.0 ˆ                  *       *   *       *   *       *   *               *   *
 F     ‚                      *   *   *           *   *   *   *   *
 r     ‚                          *       *           *       *
 e     ‚                      *               *
 s     ‚                  *                       *                       *
 h     ‚                                  *       *
 m 2.5 ˆ                  *           *   *       *
 a     ‚          *               *   *                           *
 n     ‚                  *
       ‚                          *                       *
 y     ‚                          *                           *               *
 e     ‚                          *                       *           *
 a 2.0 ˆ      *
 r     ‚
       ‚          *       *                           *
 G     ‚
 P     ‚
 A     ‚                  *
   1.5 ˆ                                                                      *
       ‚
       ‚
       ‚
       ‚
       ‚
   1.0 ˆ
       ‚
       ‚
       ‚
       ‚
       ‚
   0.5 ˆ                                                              *
       Šƒƒˆƒƒƒˆƒƒƒˆƒƒƒˆƒƒƒˆƒƒƒˆƒƒƒˆƒƒƒˆƒƒƒˆƒƒƒˆƒƒƒˆƒƒƒˆƒƒƒˆƒƒƒˆƒƒƒˆƒƒƒˆƒƒƒˆƒƒƒˆƒƒƒˆƒƒƒˆƒƒƒˆƒƒƒˆƒƒ
         14  15  16  17  18  19  20  21  22  23  24  25  26  27  28  29  30  31  32  33  34  35

                                             ACT Test Score

NOTE: 12 obs hidden.
|
| Regression with One Covariate |
| Simple Linear Regression of Freshman GPA on ACT score |
| Number of Observations Read | 120 |
|---|---|
| Number of Observations Used | 120 |
| Regression with One Covariate |
| Simple Linear Regression of Freshman GPA on ACT score |
| Source | DF | Sum of Squares | Mean Square | F Value | Pr > F |
|---|---|---|---|---|---|
| Model | 1 | 3.58784590 | 3.58784590 | 9.24 | 0.0029 |
| Error | 118 | 45.81760780 | 0.38828481 | ||
| Corrected Total | 119 | 49.40545370 |
| R-Square | Coeff Var | Root MSE | y Mean |
|---|---|---|---|
| 0.072620 | 20.27049 | 0.623125 | 3.074050 |
| Source | DF | Type I SS | Mean Square | F Value | Pr > F |
|---|---|---|---|---|---|
| x | 1 | 3.58784590 | 3.58784590 | 9.24 | 0.0029 |
| Source | DF | Type III SS | Mean Square | F Value | Pr > F |
|---|---|---|---|---|---|
| x | 1 | 3.58784590 | 3.58784590 | 9.24 | 0.0029 |
| Parameter | Estimate | Standard Error | t Value | Pr > |t| |
|---|---|---|---|---|
| Intercept | 2.114049287 | 0.32089483 | 6.59 | <.0001 |
| x | 0.038827127 | 0.01277302 | 3.04 | 0.0029 |
| Regression with One Covariate |
| Regression Line with Observed Values |
| Number of Observations Read | 120 |
|---|---|
| Number of Observations Used | 120 |
| Analysis of Variance | |||||
|---|---|---|---|---|---|
| Source | DF | Sum of Squares |
Mean Square |
F Value | Pr > F |
| Model | 1 | 3.58785 | 3.58785 | 9.24 | 0.0029 |
| Error | 118 | 45.81761 | 0.38828 | ||
| Corrected Total | 119 | 49.40545 | |||
| Root MSE | 0.62313 | R-Square | 0.0726 |
|---|---|---|---|
| Dependent Mean | 3.07405 | Adj R-Sq | 0.0648 |
| Coeff Var | 20.27049 |
| Parameter Estimates | ||||||
|---|---|---|---|---|---|---|
| Variable | Label | DF | Parameter Estimate |
Standard Error |
t Value | Pr > |t| |
| Intercept | Intercept | 1 | 2.11405 | 0.32089 | 6.59 | <.0001 |
| x | ACT Test Score | 1 | 0.03883 | 0.01277 | 3.04 | 0.0029 |
| Regression with One Covariate |
| Test for Randomness of Residuals |
| Dependent Variable | residuals |
|---|
| Regression with One Covariate |
| Test for Randomness of Residuals |
| Ordinary Least Squares Estimates | |||
|---|---|---|---|
| SSE | 45.7631246 | DFE | 118 |
| MSE | 0.38782 | Root MSE | 0.62275 |
| SBC | 234.438658 | AIC | 228.863674 |
| MAE | 0.47329114 | AICC | 228.966238 |
| MAPE | 98.3082047 | Regress R-Square | 0.0012 |
| Total R-Square | 0.0012 | ||
| Durbin-Watson Statistics | |||
|---|---|---|---|
| Order | DW | Pr < DW | Pr > DW |
| 1 | 1.8328 | 0.1555 | 0.8445 |
| 2 | 1.8264 | 0.1699 | 0.8301 |
| 3 | 2.1474 | 0.8171 | 0.1829 |
| 4 | 1.9591 | 0.4854 | 0.5146 |
| Note: | Pr<DW is the p-value for testing positive autocorrelation, and Pr>DW is the p-value for testing negative autocorrelation. |
| Variable | DF | Estimate | Standard Error | t Value | Approx Pr > |t| |
|---|---|---|---|---|---|
| Intercept | 1 | 0.0372 | 0.1144 | 0.33 | 0.7456 |
| obs | 1 | -0.000615 | 0.001641 | -0.37 | 0.7085 |
| Regression with One Covariate |
| Autocorrelation Plot |
| Name of Variable = residuals | |
|---|---|
| Mean of Working Series | 2.66E-16 |
| Standard Deviation | 0.617911 |
| Number of Observations | 120 |
| Autocorrelations | ||||
|---|---|---|---|---|
| Lag | Covariance | Correlation | -1 9 8 7 6 5 4 3 2 1 0 1 2 3 4 5 6 7 8 9 1 | Std Error |
| 0 | 0.381813 | 1.00000 | | |********************| | 0 |
| 1 | 0.028159 | 0.07375 | | . |* . | | 0.091287 |
| 2 | 0.019884 | 0.05208 | | . |* . | | 0.091782 |
| 3 | -0.044838 | -.11744 | | . **| . | | 0.092028 |
| 4 | -0.011007 | -.02883 | | . *| . | | 0.093269 |
| 5 | 0.0054837 | 0.01436 | | . | . | | 0.093343 |
| 6 | -0.040137 | -.10512 | | . **| . | | 0.093361 |
| 7 | -0.0084828 | -.02222 | | . | . | | 0.094343 |
| 8 | -0.063598 | -.16657 | | .***| . | | 0.094386 |
| 9 | 0.0066450 | 0.01740 | | . | . | | 0.096805 |
| 10 | -0.018912 | -.04953 | | . *| . | | 0.096831 |
| 11 | 0.0025363 | 0.00664 | | . | . | | 0.097042 |
| 12 | 0.0074068 | 0.01940 | | . | . | | 0.097045 |
| 13 | -0.027137 | -.07108 | | . *| . | | 0.097078 |
| 14 | 0.0081595 | 0.02137 | | . | . | | 0.097510 |
| 15 | -0.017902 | -.04689 | | . *| . | | 0.097549 |
| 16 | -0.019405 | -.05082 | | . *| . | | 0.097737 |
| 17 | -0.016913 | -.04430 | | . *| . | | 0.097957 |
| 18 | 0.032057 | 0.08396 | | . |** . | | 0.098124 |
| 19 | -0.022652 | -.05933 | | . *| . | | 0.098721 |
| 20 | -0.015346 | -.04019 | | . *| . | | 0.099017 |
| 21 | 0.032200 | 0.08433 | | . |** . | | 0.099153 |
| 22 | -0.030472 | -.07981 | | . **| . | | 0.099749 |
| 23 | 0.027848 | 0.07294 | | . |* . | | 0.100280 |
| 24 | -0.0070677 | -.01851 | | . | . | | 0.100721 |
| Inverse Autocorrelations | ||
|---|---|---|
| Lag | Correlation | -1 9 8 7 6 5 4 3 2 1 0 1 2 3 4 5 6 7 8 9 1 |
| 1 | -0.09458 | | . **| . | |
| 2 | -0.02299 | | . | . | |
| 3 | 0.24595 | | . |***** | |
| 4 | 0.00212 | | . | . | |
| 5 | 0.02106 | | . | . | |
| 6 | 0.16029 | | . |***. | |
| 7 | 0.02595 | | . |* . | |
| 8 | 0.15590 | | . |***. | |
| 9 | 0.03375 | | . |* . | |
| 10 | 0.05794 | | . |* . | |
| 11 | 0.06435 | | . |* . | |
| 12 | -0.00941 | | . | . | |
| 13 | 0.11065 | | . |** . | |
| 14 | 0.04643 | | . |* . | |
| 15 | -0.03445 | | . *| . | |
| 16 | 0.16172 | | . |***. | |
| 17 | 0.03305 | | . |* . | |
| 18 | -0.10844 | | . **| . | |
| 19 | 0.14039 | | . |***. | |
| 20 | 0.03734 | | . |* . | |
| 21 | -0.09347 | | . **| . | |
| 22 | 0.12104 | | . |** . | |
| 23 | -0.02910 | | . *| . | |
| 24 | 0.00408 | | . | . | |
| Partial Autocorrelations | ||
|---|---|---|
| Lag | Correlation | -1 9 8 7 6 5 4 3 2 1 0 1 2 3 4 5 6 7 8 9 1 |
| 1 | 0.07375 | | . |* . | |
| 2 | 0.04689 | | . |* . | |
| 3 | -0.12551 | | .***| . | |
| 4 | -0.01385 | | . | . | |
| 5 | 0.03138 | | . |* . | |
| 6 | -0.12377 | | . **| . | |
| 7 | -0.01340 | | . | . | |
| 8 | -0.15064 | | .***| . | |
| 9 | 0.01612 | | . | . | |
| 10 | -0.04849 | | . *| . | |
| 11 | -0.02590 | | . *| . | |
| 12 | 0.01183 | | . | . | |
| 13 | -0.08754 | | . **| . | |
| 14 | -0.00832 | | . | . | |
| 15 | -0.04108 | | . *| . | |
| 16 | -0.10794 | | . **| . | |
| 17 | -0.03293 | | . *| . | |
| 18 | 0.07620 | | . |** . | |
| 19 | -0.12029 | | . **| . | |
| 20 | -0.05161 | | . *| . | |
| 21 | 0.09100 | | . |** . | |
| 22 | -0.13826 | | .***| . | |
| 23 | 0.03377 | | . |* . | |
| 24 | -0.00487 | | . | . | |
| Autocorrelation Check for White Noise | |||||||||
|---|---|---|---|---|---|---|---|---|---|
| To Lag | Chi-Square | DF | Pr > ChiSq | Autocorrelations | |||||
| 6 | 4.28 | 6 | 0.6386 | 0.074 | 0.052 | -0.117 | -0.029 | 0.014 | -0.105 |
| 12 | 8.40 | 12 | 0.7535 | -0.022 | -0.167 | 0.017 | -0.050 | 0.007 | 0.019 |
| 18 | 11.11 | 18 | 0.8896 | -0.071 | 0.021 | -0.047 | -0.051 | -0.044 | 0.084 |
| 24 | 14.72 | 24 | 0.9288 | -0.059 | -0.040 | 0.084 | -0.080 | 0.073 | -0.019 |
| Regression with One Covariate |
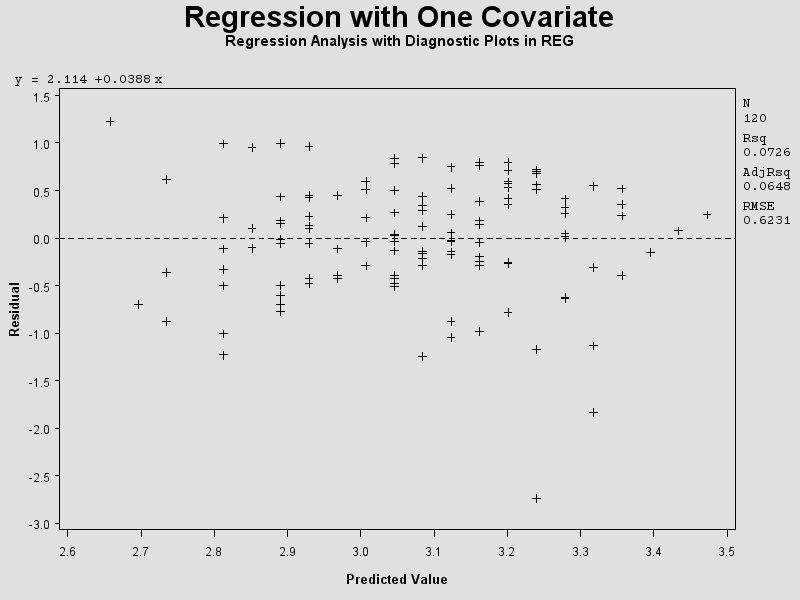
| Residual Plots for Linear Regression |
                            Plot of residuals*x.  Symbol used is '*'.

residuals ‚
          ‚
      1.5 ˆ
          ‚
          ‚ *
          ‚
      1.0 ˆ                 *   *   *   *
          ‚                                         *   *
          ‚                                         *       *   *   *   *
          ‚         *                           *                   *   *
      0.5 ˆ                             *   *   *   *       *       *   *       *   *
          ‚                         *   *               *       *   *       *       *
          ‚                 *           *       *   *   *   *               *       *           *
          ‚                     *   *   *               *       *                           *
      0.0 ˆƒƒƒƒƒƒƒƒƒƒƒƒƒƒƒƒƒƒƒƒƒƒƒƒƒ*ƒƒƒ*ƒƒƒƒƒƒƒ*ƒƒƒ*ƒƒƒƒƒƒƒ*ƒƒƒ*ƒƒƒƒƒƒƒƒƒƒƒ*ƒƒƒƒƒƒƒƒƒƒƒƒƒƒƒƒƒƒƒƒƒ
          ‚                 *   *           *       *   *   *                           *
          ‚                                     *       *       *   *           *
          ‚         *       *           *   *       *                               *
     -0.5 ˆ                 *       *   *           *
          ‚                         *                                       *
          ‚     *                   *                               *
          ‚         *                                       *
     -1.0 ˆ                 *                               *   *
          ‚                                                             *       *
          ‚                 *                           *
          ‚
     -1.5 ˆ
          ‚
          ‚
          ‚                                                                     *
     -2.0 ˆ
          ‚
          ‚
          ‚
     -2.5 ˆ
          ‚
          ‚                                                             *
          ‚
     -3.0 ˆ
          ‚
          Šƒˆƒƒƒˆƒƒƒˆƒƒƒˆƒƒƒˆƒƒƒˆƒƒƒˆƒƒƒˆƒƒƒˆƒƒƒˆƒƒƒˆƒƒƒˆƒƒƒˆƒƒƒˆƒƒƒˆƒƒƒˆƒƒƒˆƒƒƒˆƒƒƒˆƒƒƒˆƒƒƒˆƒƒƒˆƒ
           14  15  16  17  18  19  20  21  22  23  24  25  26  27  28  29  30  31  32  33  34  35

                                               ACT Test Score

NOTE: 28 obs hidden.
|
| Regression with One Covariate |
| Residual Plots for Linear Regression |
                        Plot of standres*prediction.  Symbol used is '*'.

             2 ˆ      *
               ‚
               ‚                 *    *
               ‚                    *    *
               ‚                                 *  *    *  *
               ‚                                       * *  *  *
             1 ˆ           *                  *             *
               ‚                              *  *     *    *  *    *  *
               ‚                      *  *  *       *    *  *     *
               ‚                                 *  *       *     *    *
               ‚                 *    *  *    *        * *             *       *
               ‚                    * *  *          *  * *                  *
             0 ˆƒƒƒƒƒƒƒƒƒƒƒƒƒƒƒƒƒƒƒƒƒƒ*ƒƒƒƒƒƒƒ*ƒƒ*ƒƒƒƒƒ*ƒ*ƒƒƒƒƒƒƒƒ*ƒƒƒƒƒƒƒƒƒƒƒƒƒƒƒƒƒƒƒƒƒƒƒƒ
               ‚                 *  * *  *  *    *  *  *                  *
               ‚                                    *  * *  *
      standres ‚                 *            *     *    *  *       *
               ‚           *             *  *    *                     *
               ‚                 *    *  *       *
            -1 ˆ                      *                           *
               ‚         *            *
               ‚                      *                *    *
               ‚           *                             *
               ‚                 *                     *
               ‚                                               *    *
            -2 ˆ                 *                  *
               ‚
               ‚
               ‚
               ‚
               ‚
            -3 ˆ                                                    *
               ‚
               ‚
               ‚
               ‚
               ‚
            -4 ˆ
               ‚
               ‚
               ‚                                               *
               ‚
               ‚
            -5 ˆ
               Šƒƒˆƒƒƒƒƒƒƒƒƒƒƒƒƒˆƒƒƒƒƒƒƒƒƒƒƒƒƒˆƒƒƒƒƒƒƒƒƒƒƒƒƒˆƒƒƒƒƒƒƒƒƒƒƒƒƒˆƒƒƒƒƒƒƒƒƒƒƒƒƒˆƒƒ
                 2.6           2.8           3.0           3.2           3.4           3.6

                                                prediction

NOTE: 19 obs hidden.
|
| Regression with One Covariate |
| Residual Plots with Possible Outliers (ID) |
| Number of Observations Read | 120 |
|---|---|
| Number of Observations Used | 120 |
| Analysis of Variance | |||||
|---|---|---|---|---|---|
| Source | DF | Sum of Squares |
Mean Square |
F Value | Pr > F |
| Model | 1 | 3.58785 | 3.58785 | 9.24 | 0.0029 |
| Error | 118 | 45.81761 | 0.38828 | ||
| Corrected Total | 119 | 49.40545 | |||
| Root MSE | 0.62313 | R-Square | 0.0726 |
|---|---|---|---|
| Dependent Mean | 3.07405 | Adj R-Sq | 0.0648 |
| Coeff Var | 20.27049 |
| Parameter Estimates | ||||||
|---|---|---|---|---|---|---|
| Variable | Label | DF | Parameter Estimate |
Standard Error |
t Value | Pr > |t| |
| Intercept | Intercept | 1 | 2.11405 | 0.32089 | 6.59 | <.0001 |
| x | ACT Test Score | 1 | 0.03883 | 0.01277 | 3.04 | 0.0029 |
| Regression with One Covariate |
| Residual Plots with Possible Outliers (ID) |
| Test of First and Second Moment Specification |
||
|---|---|---|
| DF | Chi-Square | Pr > ChiSq |
| 2 | 3.05 | 0.2181 |
| Durbin-Watson D | 1.831 |
|---|---|
| Number of Observations | 120 |
| 1st Order Autocorrelation | 0.074 |
| Regression with One Covariate |
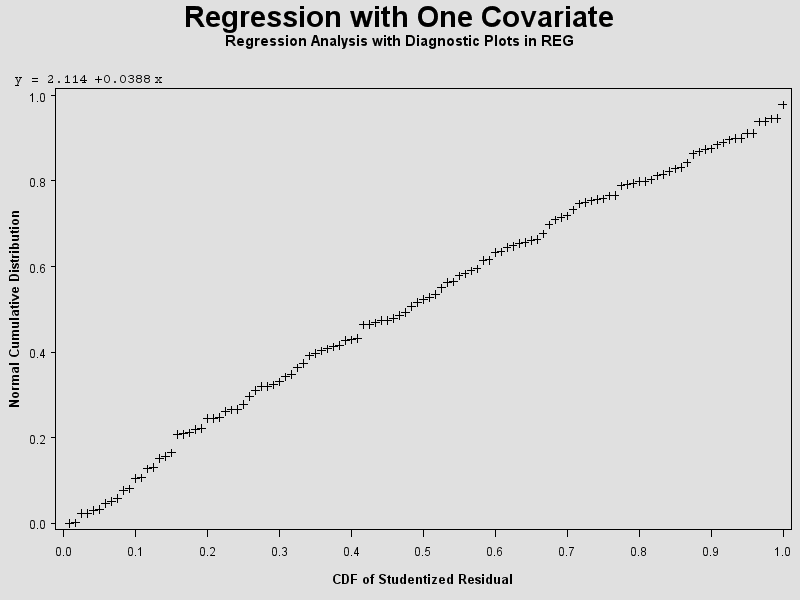
| Checking the normality of the residuals |
| Normal Probability Plot |
| Moments | |||
|---|---|---|---|
| N | 120 | Sum Weights | 120 |
| Mean | 0 | Sum Observations | 0 |
| Std Deviation | 0.62050134 | Variance | 0.38502191 |
| Skewness | -1.0067279 | Kurtosis | 2.50187662 |
| Uncorrected SS | 45.8176078 | Corrected SS | 45.8176078 |
| Coeff Variation | . | Std Error Mean | 0.05664376 |
| Basic Statistical Measures | |||
|---|---|---|---|
| Location | Variability | ||
| Mean | 0.000000 | Std Deviation | 0.62050 |
| Median | 0.040618 | Variance | 0.38502 |
| Mode | . | Range | 3.96741 |
| Interquartile Range | 0.78962 | ||
| Tests for Location: Mu0=0 | ||||
|---|---|---|---|---|
| Test | Statistic | p Value | ||
| Student's t | t | 0 | Pr > |t| | 1.0000 |
| Sign | M | 3 | Pr >= |M| | 0.6483 |
| Signed Rank | S | 258 | Pr >= |S| | 0.5015 |
| Tests for Normality | ||||
|---|---|---|---|---|
| Test | Statistic | p Value | ||
| Shapiro-Wilk | W | 0.952486 | Pr < W | 0.0003 |
| Kolmogorov-Smirnov | D | 0.057757 | Pr > D | >0.1500 |
| Cramer-von Mises | W-Sq | 0.105205 | Pr > W-Sq | 0.0963 |
| Anderson-Darling | A-Sq | 0.771412 | Pr > A-Sq | 0.0450 |
| Quantiles (Definition 5) | |
|---|---|
| Quantile | Estimate |
| 100% Max | 1.2273709 |
| 99% | 0.9944082 |
| 95% | 0.8411861 |
| 90% | 0.7317047 |
| 75% Q3 | 0.4440132 |
| 50% Median | 0.0406183 |
| 25% Q1 | -0.3456104 |
| 10% | -0.7769003 |
| 5% | -1.0896224 |
| 1% | -1.8316902 |
| 0% Min | -2.7400360 |
| Extreme Observations | |||
|---|---|---|---|
| Lowest | Highest | ||
| Value | Obs | Value | Obs |
| -2.74004 | 9 | 0.956235 | 89 |
| -1.83169 | 115 | 0.967581 | 1 |
| -1.24373 | 101 | 0.993062 | 50 |
| -1.22994 | 102 | 0.994408 | 116 |
| -1.17104 | 45 | 1.227371 | 2 |
| Regression with One Covariate |
| Checking the normality of the residuals |
| Normal Probability Plot |
| Moments | |||
|---|---|---|---|
| N | 120 | Sum Weights | 120 |
| Mean | -0.0001906 | Sum Observations | -0.0228764 |
| Std Deviation | 1.00535979 | Variance | 1.0107483 |
| Skewness | -1.0029479 | Kurtosis | 2.49686152 |
| Uncorrected SS | 120.279053 | Corrected SS | 120.279048 |
| Coeff Variation | -527369.28 | Std Error Mean | 0.09177637 |
| Basic Statistical Measures | |||
|---|---|---|---|
| Location | Variability | ||
| Mean | -0.00019 | Std Deviation | 1.00536 |
| Median | 0.06567 | Variance | 1.01075 |
| Mode | . | Range | 6.46088 |
| Interquartile Range | 1.28048 | ||
| Tests for Location: Mu0=0 | ||||
|---|---|---|---|---|
| Test | Statistic | p Value | ||
| Student's t | t | -0.00208 | Pr > |t| | 0.9983 |
| Sign | M | 3 | Pr >= |M| | 0.6483 |
| Signed Rank | S | 259 | Pr >= |S| | 0.4999 |
| Tests for Normality | ||||
|---|---|---|---|---|
| Test | Statistic | p Value | ||
| Shapiro-Wilk | W | 0.952944 | Pr < W | 0.0004 |
| Kolmogorov-Smirnov | D | 0.058364 | Pr > D | >0.1500 |
| Cramer-von Mises | W-Sq | 0.106201 | Pr > W-Sq | 0.0940 |
| Anderson-Darling | A-Sq | 0.775026 | Pr > A-Sq | 0.0442 |
| Quantiles (Definition 5) | |
|---|---|
| Quantile | Estimate |
| 100% Max | 2.027999 |
| 99% | 1.615921 |
| 95% | 1.355694 |
| 90% | 1.181628 |
| 75% Q3 | 0.716125 |
| 50% Median | 0.065673 |
| 25% Q1 | -0.564357 |
| 10% | -1.256409 |
| 5% | -1.763987 |
| 1% | -2.976785 |
| 0% Min | -4.432883 |
| Extreme Observations | |||
|---|---|---|---|
| Lowest | Highest | ||
| Value | Obs | Value | Obs |
| -4.43288 | 9 | 1.55183 | 89 |
| -2.97678 | 115 | 1.56390 | 1 |
| -2.00435 | 101 | 1.61017 | 116 |
| -2.00137 | 102 | 1.61592 | 50 |
| -1.89452 | 45 | 2.02800 | 2 |
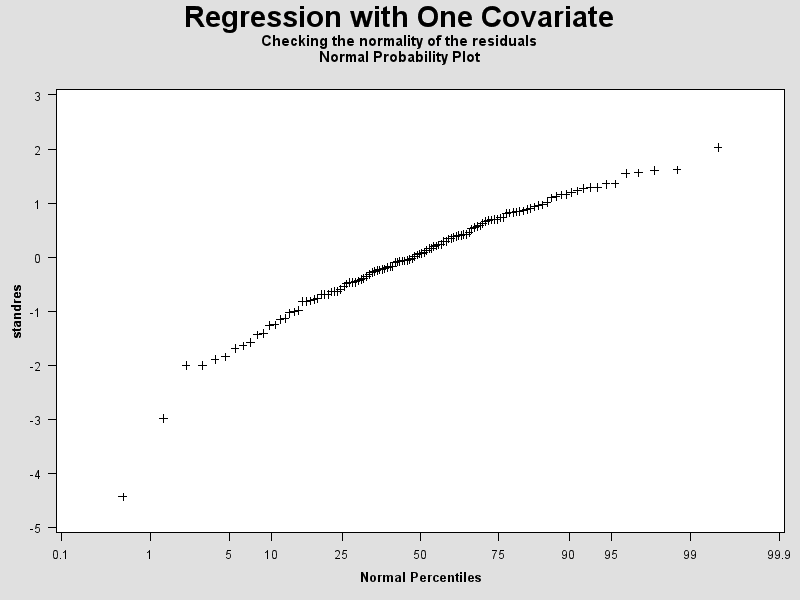
| Regression with One Covariate |
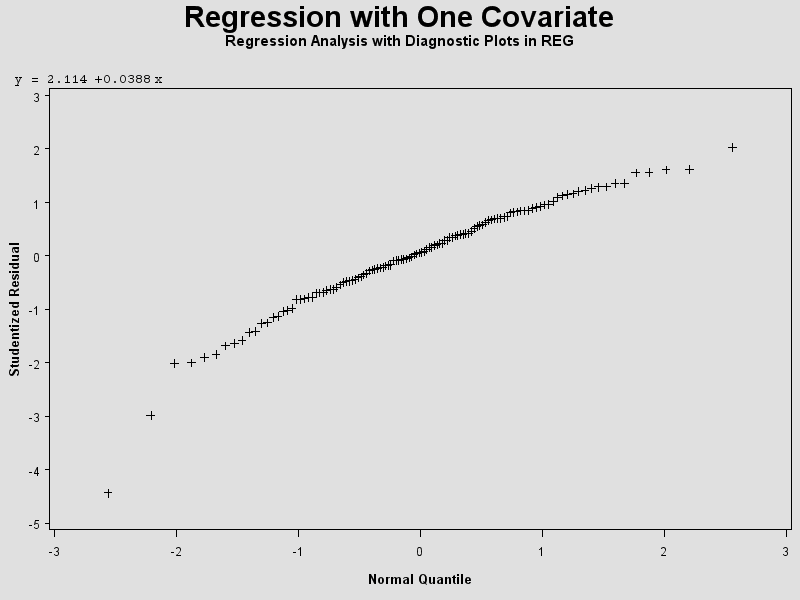
| Checking the normality of the residuals |
| Normal Quantile-Quantile plot of standardized residuals |
| Moments | |||
|---|---|---|---|
| N | 120 | Sum Weights | 120 |
| Mean | -0.0001906 | Sum Observations | -0.0228764 |
| Std Deviation | 1.00535979 | Variance | 1.0107483 |
| Skewness | -1.0029479 | Kurtosis | 2.49686152 |
| Uncorrected SS | 120.279053 | Corrected SS | 120.279048 |
| Coeff Variation | -527369.28 | Std Error Mean | 0.09177637 |
| Basic Statistical Measures | |||
|---|---|---|---|
| Location | Variability | ||
| Mean | -0.00019 | Std Deviation | 1.00536 |
| Median | 0.06567 | Variance | 1.01075 |
| Mode | . | Range | 6.46088 |
| Interquartile Range | 1.28048 | ||
| Tests for Location: Mu0=0 | ||||
|---|---|---|---|---|
| Test | Statistic | p Value | ||
| Student's t | t | -0.00208 | Pr > |t| | 0.9983 |
| Sign | M | 3 | Pr >= |M| | 0.6483 |
| Signed Rank | S | 259 | Pr >= |S| | 0.4999 |
| Quantiles (Definition 5) | |
|---|---|
| Quantile | Estimate |
| 100% Max | 2.0279985875 |
| 99% | 1.6159205146 |
| 95% | 1.3556939773 |
| 90% | 1.1816279818 |
| 75% Q3 | 0.7161248616 |
| 50% Median | 0.0656729755 |
| 25% Q1 | -0.5643567808 |
| 10% | -1.2564091850 |
| 5% | -1.7639874051 |
| 1% | -2.9767845318 |
| 0% Min | -4.4328828226 |
| Extreme Observations | |||
|---|---|---|---|
| Lowest | Highest | ||
| Value | Obs | Value | Obs |
| -4.43288282 | 9 | 1.55182758 | 89 |
| -2.97678453 | 115 | 1.56390270 | 1 |
| -2.00435259 | 101 | 1.61016558 | 116 |
| -2.00136597 | 102 | 1.61592051 | 50 |
| -1.89452448 | 45 | 2.02799859 | 2 |
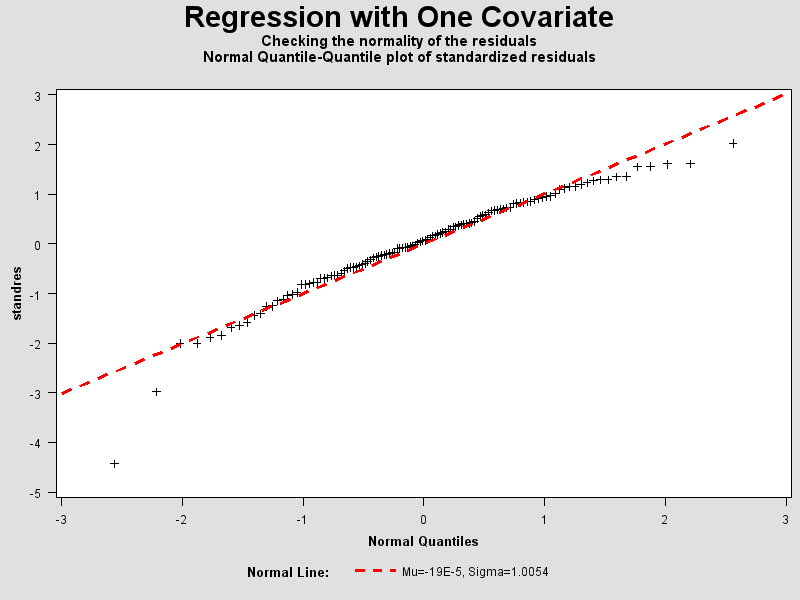
| Regression with One Covariate |
| Regression Analysis with Diagnostic Plots in REG |
| Number of Observations Read | 120 |
|---|---|
| Number of Observations Used | 120 |
| Analysis of Variance | |||||
|---|---|---|---|---|---|
| Source | DF | Sum of Squares |
Mean Square |
F Value | Pr > F |
| Model | 1 | 3.58785 | 3.58785 | 9.24 | 0.0029 |
| Error | 118 | 45.81761 | 0.38828 | ||
| Corrected Total | 119 | 49.40545 | |||
| Root MSE | 0.62313 | R-Square | 0.0726 |
|---|---|---|---|
| Dependent Mean | 3.07405 | Adj R-Sq | 0.0648 |
| Coeff Var | 20.27049 |
| Parameter Estimates | ||||||
|---|---|---|---|---|---|---|
| Variable | Label | DF | Parameter Estimate |
Standard Error |
t Value | Pr > |t| |
| Intercept | Intercept | 1 | 2.11405 | 0.32089 | 6.59 | <.0001 |
| x | ACT Test Score | 1 | 0.03883 | 0.01277 | 3.04 | 0.0029 |
| Regression with One Covariate |
| Regression Analysis with Diagnostic Plots in REG |
| Output Statistics | ||||||||
|---|---|---|---|---|---|---|---|---|
| Obs | Dependent Variable |
Predicted Value |
Std Error Mean Predict |
Residual | Std Error Residual |
Student Residual |
-2-1 0 1 2 | Cook's D |
| 1 | 3.8970 | 2.9294 | 0.0742 | 0.9676 | 0.619 | 1.564 | | |*** | | 0.018 |
| 2 | 3.8850 | 2.6576 | 0.1483 | 1.2274 | 0.605 | 2.028 | | |**** | | 0.124 |
| 3 | 3.7780 | 3.2012 | 0.0706 | 0.5768 | 0.619 | 0.932 | | |* | | 0.006 |
| 4 | 2.5400 | 2.9682 | 0.0667 | -0.4282 | 0.620 | -0.691 | | *| | | 0.003 |
| 5 | 3.0280 | 2.9294 | 0.0742 | 0.0986 | 0.619 | 0.159 | | | | | 0.000 |
| 6 | 3.8650 | 3.3177 | 0.0983 | 0.5473 | 0.615 | 0.889 | | |* | | 0.010 |
| 7 | 2.9620 | 3.3565 | 0.1090 | -0.3945 | 0.614 | -0.643 | | *| | | 0.007 |
| 8 | 3.9610 | 3.1624 | 0.0639 | 0.7986 | 0.620 | 1.288 | | |** | | 0.009 |
| 9 | 0.5000 | 3.2400 | 0.0789 | -2.7400 | 0.618 | -4.433 | |******| | | 0.160 |
| 10 | 3.1780 | 3.1236 | 0.0592 | 0.0544 | 0.620 | 0.0878 | | | | | 0.000 |
| 11 | 3.3100 | 3.0459 | 0.0576 | 0.2641 | 0.620 | 0.426 | | | | | 0.001 |
| 12 | 3.5380 | 3.2789 | 0.0882 | 0.2591 | 0.617 | 0.420 | | | | | 0.002 |
| 13 | 3.0830 | 3.0459 | 0.0576 | 0.0371 | 0.620 | 0.0598 | | | | | 0.000 |
| 14 | 3.0130 | 3.0459 | 0.0576 | -0.0329 | 0.620 | -0.0530 | | | | | 0.000 |
| 15 | 3.2450 | 3.3953 | 0.1200 | -0.1503 | 0.611 | -0.246 | | | | | 0.001 |
| 16 | 2.9630 | 3.1624 | 0.0639 | -0.1994 | 0.620 | -0.322 | | | | | 0.001 |
| 17 | 3.5220 | 3.0847 | 0.0570 | 0.4373 | 0.621 | 0.705 | | |* | | 0.002 |
| 18 | 3.0130 | 3.3177 | 0.0983 | -0.3047 | 0.615 | -0.495 | | | | | 0.003 |
| 19 | 2.9470 | 3.0847 | 0.0570 | -0.1377 | 0.621 | -0.222 | | | | | 0.000 |
| 20 | 2.1180 | 2.8906 | 0.0829 | -0.7726 | 0.618 | -1.251 | | **| | | 0.014 |
| 21 | 2.5630 | 3.0459 | 0.0576 | -0.4829 | 0.620 | -0.778 | | *| | | 0.003 |
| 22 | 3.3570 | 2.9294 | 0.0742 | 0.4276 | 0.619 | 0.691 | | |* | | 0.003 |
| 23 | 3.7310 | 3.2012 | 0.0706 | 0.5298 | 0.619 | 0.856 | | |* | | 0.005 |
| 24 | 3.9250 | 3.1624 | 0.0639 | 0.7626 | 0.620 | 1.230 | | |** | | 0.008 |
| 25 | 3.5560 | 3.2012 | 0.0706 | 0.3548 | 0.619 | 0.573 | | |* | | 0.002 |
| 26 | 3.1010 | 3.1236 | 0.0592 | -0.0226 | 0.620 | -0.0364 | | | | | 0.000 |
| 27 | 2.4200 | 3.2012 | 0.0706 | -0.7812 | 0.619 | -1.262 | | **| | | 0.010 |
| 28 | 2.5790 | 2.9682 | 0.0667 | -0.3892 | 0.620 | -0.628 | | *| | | 0.002 |
| 29 | 3.8710 | 3.1236 | 0.0592 | 0.7474 | 0.620 | 1.205 | | |** | | 0.007 |
| 30 | 3.0600 | 2.9294 | 0.0742 | 0.1306 | 0.619 | 0.211 | | | | | 0.000 |
| 31 | 3.9270 | 3.0847 | 0.0570 | 0.8423 | 0.621 | 1.357 | | |** | | 0.008 |
| 32 | 2.3750 | 2.7353 | 0.1251 | -0.3603 | 0.610 | -0.590 | | *| | | 0.007 |
| 33 | 2.9290 | 3.2012 | 0.0706 | -0.2722 | 0.619 | -0.440 | | | | | 0.001 |
| 34 | 3.3750 | 3.1236 | 0.0592 | 0.2514 | 0.620 | 0.405 | | | | | 0.001 |
| 35 | 2.8570 | 2.9682 | 0.0667 | -0.1112 | 0.620 | -0.180 | | | | | 0.000 |
| 36 | 3.0720 | 3.0459 | 0.0576 | 0.0261 | 0.620 | 0.0421 | | | | | 0.000 |
| 37 | 3.3810 | 2.9294 | 0.0742 | 0.4516 | 0.619 | 0.730 | | |* | | 0.004 |
| 38 | 3.2900 | 3.2789 | 0.0882 | 0.0111 | 0.617 | 0.0181 | | | | | 0.000 |
| 39 | 3.5490 | 3.1624 | 0.0639 | 0.3866 | 0.620 | 0.624 | | |* | | 0.002 |
| 40 | 3.6460 | 3.1236 | 0.0592 | 0.5224 | 0.620 | 0.842 | | |* | | 0.003 |
| 41 | 2.9780 | 3.1236 | 0.0592 | -0.1456 | 0.620 | -0.235 | | | | | 0.000 |
| 42 | 2.6540 | 3.2789 | 0.0882 | -0.6249 | 0.617 | -1.013 | | **| | | 0.010 |
| 43 | 2.5400 | 3.0459 | 0.0576 | -0.5059 | 0.620 | -0.815 | | *| | | 0.003 |
| 44 | 2.2500 | 3.1236 | 0.0592 | -0.8736 | 0.620 | -1.408 | | **| | | 0.009 |
| 45 | 2.0690 | 3.2400 | 0.0789 | -1.1710 | 0.618 | -1.895 | | ***| | | 0.029 |
| 46 | 2.6170 | 3.0459 | 0.0576 | -0.4289 | 0.620 | -0.691 | | *| | | 0.002 |
| 47 | 2.1830 | 3.3177 | 0.0983 | -1.1347 | 0.615 | -1.844 | | ***| | | 0.043 |
| 48 | 2.0000 | 2.6965 | 0.1366 | -0.6965 | 0.608 | -1.146 | | **| | | 0.033 |
| 49 | 2.9520 | 2.8518 | 0.0926 | 0.1002 | 0.616 | 0.163 | | | | | 0.000 |
| 50 | 3.8060 | 2.8129 | 0.1030 | 0.9931 | 0.615 | 1.616 | | |*** | | 0.037 |
| 51 | 2.8710 | 3.1624 | 0.0639 | -0.2914 | 0.620 | -0.470 | | | | | 0.001 |
| 52 | 3.3520 | 2.7353 | 0.1251 | 0.6167 | 0.610 | 1.010 | | |** | | 0.021 |
| 53 | 3.3050 | 3.1624 | 0.0639 | 0.1426 | 0.620 | 0.230 | | | | | 0.000 |
| 54 | 2.9520 | 3.1236 | 0.0592 | -0.1716 | 0.620 | -0.277 | | | | | 0.000 |
| 55 | 3.5470 | 3.0459 | 0.0576 | 0.5011 | 0.620 | 0.808 | | |* | | 0.003 |
| 56 | 3.6910 | 3.2789 | 0.0882 | 0.4121 | 0.617 | 0.668 | | |* | | 0.005 |
| 57 | 3.1600 | 2.9294 | 0.0742 | 0.2306 | 0.619 | 0.373 | | | | | 0.001 |
| 58 | 2.1940 | 2.8906 | 0.0829 | -0.6966 | 0.618 | -1.128 | | **| | | 0.011 |
| 59 | 3.3230 | 3.2789 | 0.0882 | 0.0441 | 0.617 | 0.0716 | | | | | 0.000 |
| 60 | 3.9360 | 3.2400 | 0.0789 | 0.6960 | 0.618 | 1.126 | | |** | | 0.010 |
| 61 | 2.9220 | 3.0847 | 0.0570 | -0.1627 | 0.621 | -0.262 | | | | | 0.000 |
| 62 | 2.7160 | 3.0071 | 0.0610 | -0.2911 | 0.620 | -0.469 | | | | | 0.001 |
| 63 | 3.3700 | 3.0847 | 0.0570 | 0.2853 | 0.621 | 0.460 | | | | | 0.001 |
| 64 | 3.6060 | 3.0071 | 0.0610 | 0.5989 | 0.620 | 0.966 | | |* | | 0.005 |
| 65 | 2.6420 | 3.2789 | 0.0882 | -0.6369 | 0.617 | -1.032 | | **| | | 0.011 |
| 66 | 2.4520 | 2.9294 | 0.0742 | -0.4774 | 0.619 | -0.772 | | *| | | 0.004 |
| 67 | 2.6550 | 3.0459 | 0.0576 | -0.3909 | 0.620 | -0.630 | | *| | | 0.002 |
| 68 | 3.7140 | 3.3565 | 0.1090 | 0.3575 | 0.614 | 0.583 | | |* | | 0.005 |
| 69 | 1.8060 | 2.8129 | 0.1030 | -1.0069 | 0.615 | -1.638 | | ***| | | 0.038 |
| 70 | 3.5160 | 3.0071 | 0.0610 | 0.5089 | 0.620 | 0.821 | | |* | | 0.003 |
| 71 | 3.0390 | 2.8906 | 0.0829 | 0.1484 | 0.618 | 0.240 | | | | | 0.001 |
| 72 | 2.9660 | 3.0071 | 0.0610 | -0.0411 | 0.620 | -0.0662 | | | | | 0.000 |
| 73 | 2.4820 | 2.8129 | 0.1030 | -0.3309 | 0.615 | -0.539 | | *| | | 0.004 |
| 74 | 2.7000 | 2.8129 | 0.1030 | -0.1129 | 0.615 | -0.184 | | | | | 0.000 |
| 75 | 3.9200 | 3.2400 | 0.0789 | 0.6800 | 0.618 | 1.100 | | |** | | 0.010 |
| 76 | 2.8340 | 2.8906 | 0.0829 | -0.0566 | 0.618 | -0.0916 | | | | | 0.000 |
| 77 | 3.2220 | 3.0071 | 0.0610 | 0.2149 | 0.620 | 0.347 | | | | | 0.001 |
| 78 | 3.0840 | 3.1236 | 0.0592 | -0.0396 | 0.620 | -0.0638 | | | | | 0.000 |
| 79 | 4.0000 | 3.2012 | 0.0706 | 0.7988 | 0.619 | 1.290 | | |** | | 0.011 |
| 80 | 3.5110 | 3.4342 | 0.1314 | 0.0768 | 0.609 | 0.126 | | | | | 0.000 |
| 81 | 3.3230 | 2.8906 | 0.0829 | 0.4324 | 0.618 | 0.700 | | |* | | 0.004 |
| 82 | 3.0720 | 2.8906 | 0.0829 | 0.1814 | 0.618 | 0.294 | | | | | 0.001 |
| 83 | 2.0790 | 3.1236 | 0.0592 | -1.0446 | 0.620 | -1.684 | | ***| | | 0.013 |
| 84 | 3.8750 | 3.3565 | 0.1090 | 0.5185 | 0.614 | 0.845 | | |* | | 0.011 |
| 85 | 3.2080 | 3.0847 | 0.0570 | 0.1233 | 0.621 | 0.199 | | | | | 0.000 |
| 86 | 2.9200 | 3.1624 | 0.0639 | -0.2424 | 0.620 | -0.391 | | | | | 0.001 |
| 87 | 3.3450 | 3.1624 | 0.0639 | 0.1826 | 0.620 | 0.295 | | | | | 0.000 |
| 88 | 3.9560 | 3.2400 | 0.0789 | 0.7160 | 0.618 | 1.158 | | |** | | 0.011 |
| 89 | 3.8080 | 2.8518 | 0.0926 | 0.9562 | 0.616 | 1.552 | | |*** | | 0.027 |
| 90 | 2.5060 | 2.9294 | 0.0742 | -0.4234 | 0.619 | -0.684 | | *| | | 0.003 |
| 91 | 3.8860 | 3.0459 | 0.0576 | 0.8401 | 0.620 | 1.354 | | |** | | 0.008 |
| 92 | 2.1830 | 3.1624 | 0.0639 | -0.9794 | 0.620 | -1.580 | | ***| | | 0.013 |
| 93 | 3.4290 | 3.0847 | 0.0570 | 0.3443 | 0.621 | 0.555 | | |* | | 0.001 |
| 94 | 3.0240 | 2.8129 | 0.1030 | 0.2111 | 0.615 | 0.343 | | | | | 0.002 |
| 95 | 3.7500 | 3.2400 | 0.0789 | 0.5100 | 0.618 | 0.825 | | |* | | 0.006 |
| 96 | 3.8330 | 3.0459 | 0.0576 | 0.7871 | 0.620 | 1.269 | | |** | | 0.007 |
| 97 | 3.1130 | 3.1624 | 0.0639 | -0.0494 | 0.620 | -0.0797 | | | | | 0.000 |
| 98 | 2.8750 | 2.9294 | 0.0742 | -0.0544 | 0.619 | -0.0880 | | | | | 0.000 |
| 99 | 2.7470 | 2.8518 | 0.0926 | -0.1048 | 0.616 | -0.170 | | | | | 0.000 |
| 100 | 2.3110 | 2.8129 | 0.1030 | -0.5019 | 0.615 | -0.817 | | *| | | 0.009 |
| 101 | 1.8410 | 3.0847 | 0.0570 | -1.2437 | 0.621 | -2.004 | | ****| | | 0.017 |
| 102 | 1.5830 | 2.8129 | 0.1030 | -1.2299 | 0.615 | -2.001 | | ****| | | 0.056 |
| 103 | 2.8790 | 2.8906 | 0.0829 | -0.0116 | 0.618 | -0.0188 | | | | | 0.000 |
| 104 | 3.5910 | 3.3565 | 0.1090 | 0.2345 | 0.614 | 0.382 | | | | | 0.002 |
| 105 | 2.9140 | 3.0459 | 0.0576 | -0.1319 | 0.620 | -0.213 | | | | | 0.000 |
| 106 | 3.7160 | 3.4730 | 0.1430 | 0.2430 | 0.606 | 0.401 | | | | | 0.004 |
| 107 | 2.8000 | 3.0847 | 0.0570 | -0.2847 | 0.621 | -0.459 | | | | | 0.001 |
| 108 | 3.6210 | 3.2012 | 0.0706 | 0.4198 | 0.619 | 0.678 | | |* | | 0.003 |
| 109 | 3.7920 | 3.2012 | 0.0706 | 0.5908 | 0.619 | 0.954 | | |* | | 0.006 |
| 110 | 2.8670 | 3.0847 | 0.0570 | -0.2177 | 0.621 | -0.351 | | | | | 0.001 |
| 111 | 3.4190 | 2.9682 | 0.0667 | 0.4508 | 0.620 | 0.728 | | |* | | 0.003 |
| 112 | 3.6000 | 3.2789 | 0.0882 | 0.3211 | 0.617 | 0.521 | | |* | | 0.003 |
| 113 | 2.3940 | 2.8906 | 0.0829 | -0.4966 | 0.618 | -0.804 | | *| | | 0.006 |
| 114 | 2.2860 | 2.8906 | 0.0829 | -0.6046 | 0.618 | -0.979 | | *| | | 0.009 |
| 115 | 1.4860 | 3.3177 | 0.0983 | -1.8317 | 0.615 | -2.977 | | *****| | | 0.113 |
| 116 | 3.8850 | 2.8906 | 0.0829 | 0.9944 | 0.618 | 1.610 | | |*** | | 0.023 |
| 117 | 3.8000 | 3.2400 | 0.0789 | 0.5600 | 0.618 | 0.906 | | |* | | 0.007 |
| 118 | 3.9140 | 3.2012 | 0.0706 | 0.7128 | 0.619 | 1.151 | | |** | | 0.009 |
| 119 | 1.8600 | 2.7353 | 0.1251 | -0.8753 | 0.610 | -1.434 | | **| | | 0.043 |
| 120 | 2.9480 | 3.2012 | 0.0706 | -0.2532 | 0.619 | -0.409 | | | | | 0.001 |
| Sum of Residuals | 0 |
|---|---|
| Sum of Squared Residuals | 45.81761 |
| Predicted Residual SS (PRESS) | 47.61035 |
