Math 322
Biostatistics
Professor Wickerhauser
|
|
NEWS
|
R EXAMPLES
Example R commands for:
- mean and median r-eg-01.txt.
- histograms and samples r-eg-02.txt.
- deviation and diversity r-eg-03.txt.
- combinations and permutations r-eg-04.txt.
- box plots and confidence intervals r-eg-05.txt.
- use, power and sample size in t tests r-eg-06.txt.
- Student-t test power demo r-eg-33.txt
- Student-t tests from reduced data r-eg-34.txt
- multinomial pdf calculation and sampling r-eg-30.txt.
- Dirichlet pdf plotting in 3 variables r-eg-35.txt.
- Matrix entry; Mann-Whitney, Wilcoxon, McNemar, and median
comparison tests r-eg-07.txt.
- single-factor analysis of variance with unequal
replication r-eg-08.txt.
- multiple comparison of means r-eg-09.txt.
- homoscedasticity tests r-eg-10.txt.
- two- and three-factor ANOVA r-eg-11.txt.
- MANOVA demo r-eg-12.txt.
- bivariate normal density estimation, sampling, and plotting with
persp() and contour() r-eg-13.txt.
- simple linear regression r-eg-14.txt.
- simple correlation r-eg-15.txt.
- multiple linear regression and prediction r-eg-16.txt.
- Kendall's W r-eg-17.txt.
- partial correlation coefficients r-eg-18.txt.
- goodness of fit r-eg-19.txt.
- tests of independence in contingency tables r-eg-20.txt.
- Fisher's exact test r-eg-21.txt.
- binomial and hypergeometric densities r-eg-22.txt.
- Poisson density and one randomness test r-eg-23.txt.
- Tests of serial randomness r-eg-24.txt.
- Installing the contributed package "snpar" r-eg-25.txt.
- Gibbs sampling ma322-02-28-Rcode.txt (from the February
28th, 2011 lecture).
- rejection sampling
reject.txt
- Metropolis and Metropolis-Hastings sampling
r-eg-38.txt
- GenBank data and goodness of fit
322-R-session-2011-03-30.txt
(from the March 30th, 2011 lecture).
- multivariate visualization, principal components, Mahalanobis
distance, and linear discriminant analysis r-eg-26.txt.
- classification trees, with gene data clean-up r-eg-27.txt.
This is an updated example
for tree classification. It includes more information about computing
misclassification rates with printcp() and predict().
NOTE: The tree() function in R does not work in R version 4.0 and
higher, namely the latest versions. Use rpart() instead after
install.packages("rpart")
library(rpart)
Plotting the output of rpart() should be done with plot.rpart(),
which needs
install.packages("plot.rpart")
library(plot.rpart)
and which only works with R versions 4 and higher.
Confusingly, there is also a function named rpart.plot(),
which needs
install.packages("rpart.plot")
library(rpart.plot)
It may be used instead of plot.rpart() and has the same inputs.
- clustering by means, medoids, agglomerative and divisive trees r-eg-28.txt.
- multidimensional scaling by IsoMap r-eg-29.txt.
- bootstrap method to estimate sampling error in non-normal PDFs r-eg-32.txt.
- How normal random variables combine to give chi-squared and F densities r-eg-36.txt.
-
r-eg-37.txt is available to illustrate how the
minimum of k i.i.d. uniforms is distributed like Beta(1,k).
|
LINKS
- Example Midterm (2016).
- Example Final (2020).
- Open-source software R
for statistical computing, and its manual.
- Download R from WUStL's
software archive.
-
Download R
Studio from its developer's website.
- Download a precompiled executable Maxima, for Windows,
from SourceForge.
- Maxima project home page,
for sources, documentation, links, and precompiled binary downloads for Linux,
Macintosh and other systems.
- Download old free MatLab (for
Windows or Linux PCs) from my website.
- There is an online Octave
to R dictionary, useful
for those who know MatLab or Octave well and want to learn the
corresponding R commands.
- R program in file deduct.R to solve HW 1's DNA
sequence counting problem.
- R program in file faker.R. Then "faker(n, mu, sd)"
generates n>1 samples with exact prescribed mean mu and exact standard
deviation sd.
- Notes (brillouin.pdf) on Brillouin
and Shannon diversity, for HW 1.
- Notes (condprob.pdf) on conditional
probabilities and continuous densities, for HW 3.
- Notes (mcmc.pdf) on the
Metropolis-Hastings algorithm for MCMC.
- R program in file bvnpdf.R,
to compute bivariate normal pdfs. Read the code for usage instructions.
- R program in file dagopear.R to perform
the D'Agostino-Pearson test of normality and compute the associated
statistics.
-
R program in file cochran.R for Cochran's test of a
dichotomous variable without replication.
-
R program in file kendall.w.R to compute Kendall's
coefficient of concordance (Kendall's W). Call it using
kendall.w(tab)
where tab is a matrix with scores (or ranks) along its rows.
- NCI microarray data on 14 cancers:
- nci.info: some information on the data
- nci.names: just the 64 names identifying
14 cancers, to label the 64 rows of gene expression data.
- nci.data: gene expression data, 64 rows
of 6830 gene expression values. HINT: Save this to a file.
- Cleaned-up NCI microarray data, 57 samples of 8 cancers with top
12 expressed genes: nci57x13.R, to be saved
into your R folder and read into the R session with
load("nci57x13.R"). The result is a data frame named "nci12".
- Download nci57x7.R and
load("nci57x7.R") to get the top 6 genes data. The result is a
data frame named "nci6".
- Download nci57x6831.R and
load("nci57x6831.R") to get the full gene expression data frame,
named simply "nci".
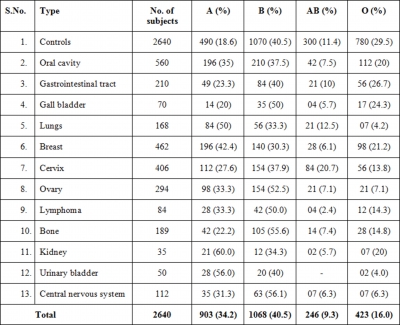
- Article and Table
1 on ABO blood types and cancer in Northern India, for the term project.
- WinBUGS and tutorials:
- Saed Sayad's notes on classifier evaluation:
-
Zach's example code
for building and pruning Classification and
Regression Trees (CART).
-
More tree
documentation: Zach's example code for building and pruning Classification and
Regression Trees (CART) in R.
-
Article feller.pdf on tests of randomness.
|
Syllabus
Topics. This is a second course in applied statistics with
examples from biology and medicine. Topics include Bayes rule, Markov
chains, maximum likelihood estimation with MCMC, classical statistical
inference, ANOVA and MANOVA, multivariate visualization, multiple
regression, correlation, and classification.
Each student will be
required to perform and write a report on a
data analysis project.
Prerequisites. Math 3200, or Math 2200 and the permission of
the instructor.
Time. Classes meet Mondays, Wednesdays and Fridays, 3:00pm
to 3:50pm, in Wrighton Hall, Room 250. Live and
recorded video of the lectures will likely be available.
Text. The lectures will follow
Statistics Using R with Biological
Examples by Kim Seefeld and Ernst Linder, an e-text that you
may download freely. (Alternative
local link.)
If you desire a paper copy, you may have it
printed and bound at any copy shop from this PDF file.
Supplementary readings and software may be found in the "LINKS" column above.
Homework. You are encouraged to collaborate on homework,
although each student must turn in solutions individually. Please
complete your solutions on GradeScope by 11pm on the due date.
Late homework will not be accepted.
For full credit, homework solutions should be clearly legible with the
answers properly labeled. For computations, include the R commands
used, the input provided, and the output with
labels indicating which part of the solution is thus computed.
Suggestion: copy and paste your R session into a text editing
program and delete unnecessary text and space, then comment and
annotate as needed. Hand in homework as you would like to
get it if you were the grader.
Problem sets
will be assigned as follows:
Tests. There will be one Midterm
Examination published at 5pm Wednesday, March 6th. It
will be due on GradeScope by 11:59pm Thursday, March
7th. Please upload your answers to Canvas/GradeScope well in advance of the deadline.
There will be one cumulative take-home Final
Examination, emphasizing the later material, due by
May 2nd, 2024, on GradeScope.
Project. There will be one data analysis project due
by May 1st, 2024, on GradeScope. A one-page Project Outline is
due April 16th, 2024.
Late projects will not be accepted. Projects may be
selected from this list, or chosen by the
student with the prior approval of the instructor.
Grading. One score will be assigned for homework, one for the
midterm examination, one for the final examination, and one for the project. These four
will contribute in respective shares of 40%, 20%, 20%, and 20% to the
course score. Letter grades, computed from the course score,
will be at least the following:
| Course score at least: | 90% | 80% | 70% | 60% |
|---|
Letter grade at least: | A | B | C | D |
Students taking the Cr/NCr or P/F options will need a grade of D or better to
pass. Students taking the Audit option will need to attend 36 of the
40 class meetings to obtain a Successful Audit grade.
Computing. Students are encouraged to use R on their own computers or on
the computers available in the Arts and Sciences Computing
Center for both symbolic and numerical computations.
Office Hours. Mondays and Wednesdays 4:00pm-5:00pm (after
class), Fridays 10:00-11:00am, or by appointment.
Questions? Return to
M. Victor Wickerhauser's home page for contact information.